It is a gas lab: Dose-response curves: the next frontier in plant ecology.
Members of the It is a gas lab, at the School of Ecology at Sun Yat-sen University have published an article in Trends in Plant Science with the title Dose response curves: the next frontier in plant ecology. The article was led by Stavros Veresoglou who is the first and co-corresponding author, whereas the postdoc Naheeda Begum is second and co-corresponding author. School of Ecology of Sun Yat-sen University is the first unit of the paper.
Link: https://authors.elsevier.com/a/1izJP_UxGnMrdP
The article combines a meta-analysis with a perspective arguing that dose-response curves hold a lot of promise in advancing plant ecology. The authors make a call to expand the scope of existing dose-response curves outside the usual context of physiological and ecotoxicological studies. Thinking of new kinds of predictors (doses) and responses can give rise to immense possibilities for future syntheses.
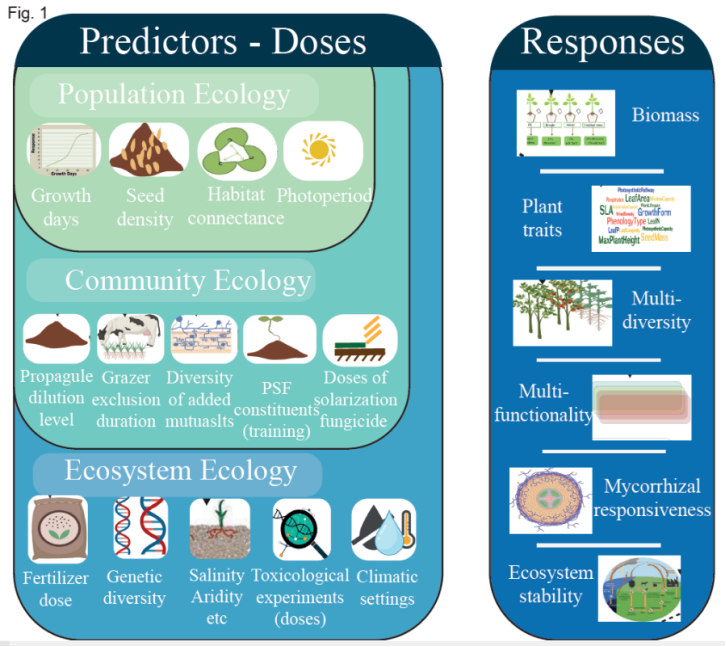
Fig. 1. Possibilities to combine predictors (left) with responses (right) to address dose-response relationships in plant ecology. Predictors are grouped into three categories in relation to whether the resulting dose-responses concern the population ecology, community ecology or ecosystem ecology of the plants. The classification of the predictors into these categories captures our interpretations of the type of the ecological question that the dose-response curves would address (i.e. is it related to plant population, community or ecosystem ecology) and are not conclusive. There is an immense pool of combinations, many of which have not been considered so far. Predictors related to the population ecology of the plants could address the growth duration, seed density, habitat connectance and photoperiod in the experimental system. In relation to the community ecology of the plants some interesting predictors are the degree to which microbial propagules get diluted before applied to a sterilized system, the duration of the exclusion of grazers from field studies, the diversity level of added mycorrhizal (and other) mutualists, the duration of the training phase in plant-soil feedback (PSF) experiments and the doses of solarization or fungicide that are implemented and can alter plant community interactions over the duration of the experiment. Finally in relation to ecosystem ecology we could think of the doses of fertilizer additions, the genetic diversity of plant material, the intensity of salinity, aridity or other climatic conditions and the likely availability of toxic compounds.
The authors assess likely benefits of expanding the scope of existing dose-response studies. These include assessing the exact nature of relationships and the relative parsimony of competing predictive models, compliment core ecological theory with empirical data, increase the the visibility of some historic, well-executed studies, but also address emerging issues in plant ecology such as microplastic pollution.
The authors subsequently present a case study of an unusual combination of a predictor and a response to showcase the potential of the approach. More specifically the combine photoperiod as a predictor and mycorrhizal responsiveness as a response to identify a new null hypothesis in mycorrhizal ecology, that mycorrhizal responsiveness shows a U-shaped response to photoperiod.

Fig. 2. Mycorrhizal responsiveness (y-axis – log response ratio of biomass with mycorrhiza over biomass without mycorrhiza) across the different photoperiod classes (x-axis – classes correspond to hours of light daily in h). We present the likely dose-response relationship in the form of boxplots (horizontal lines capture the median and the 1st and 3rd quartiles) across the different doses of light. We report the number of trials we included in each class (text on the top of each class) and the median (bold text). Each photoperiod class captured the maximum light hour duration in the class. We carried out a weighted fixed effects meta-analysis on those data and observed differences across the photoperiod classes – we report the statistics (between groups Q statistic, QM and within groups, QH) on the bottom right of the figure. We did not feel that our analysis was sufficiently conclusive to fit an actual dose response model but discuss in the supplement how we interpret the results and why we think they are important. The take home message was that despite the range of observations (blue colored circles) there is a clear U shape in the medians which is suggestive of a non-monotonic dose-response relationship. Horizontal lines in the boxplots represent the 1st quartile, median and 3rd quartile of the distribution of mycorrhizal responsiveness values.
The authors finally encourage plant ecologists to think about their systems and likely possibilities to implement dose-response approaches there.
作者简介

Stavros Veresoglou and Naheeda Begum are members of the it is a gas lab at the School of Ecology at Sun Yat-sen university. The expression “it is a gas” in English means that something is thoroughly entertaining. In the it is a gas lab, we work on greenhouse gases and we really enjoy ourselves (we are actually equipped with our own gas chromatograph). The focus of the lab is on global change biology and a lot of the ongoing research addresses mycorrhizas, symbiotic associations between the roots of terrestrial plants and fungi. For inquiries to join the lab please contact (inquiries can be in Chinese or in English) Junjiang Chen (陈俊江) at chenjj353@mail2.sysu.edu.cn.